ⓘEducational use only — not medical advice. This is a teaching example and must not be used to guide care of any individual patient.Learn more →
Circuit Leak due to Alveolar-Pleural Fistula
The waveform signs of a circuit leak, in this case from an alveolar-pleural fistula.
LeaksMechanicsM3M5
⤢
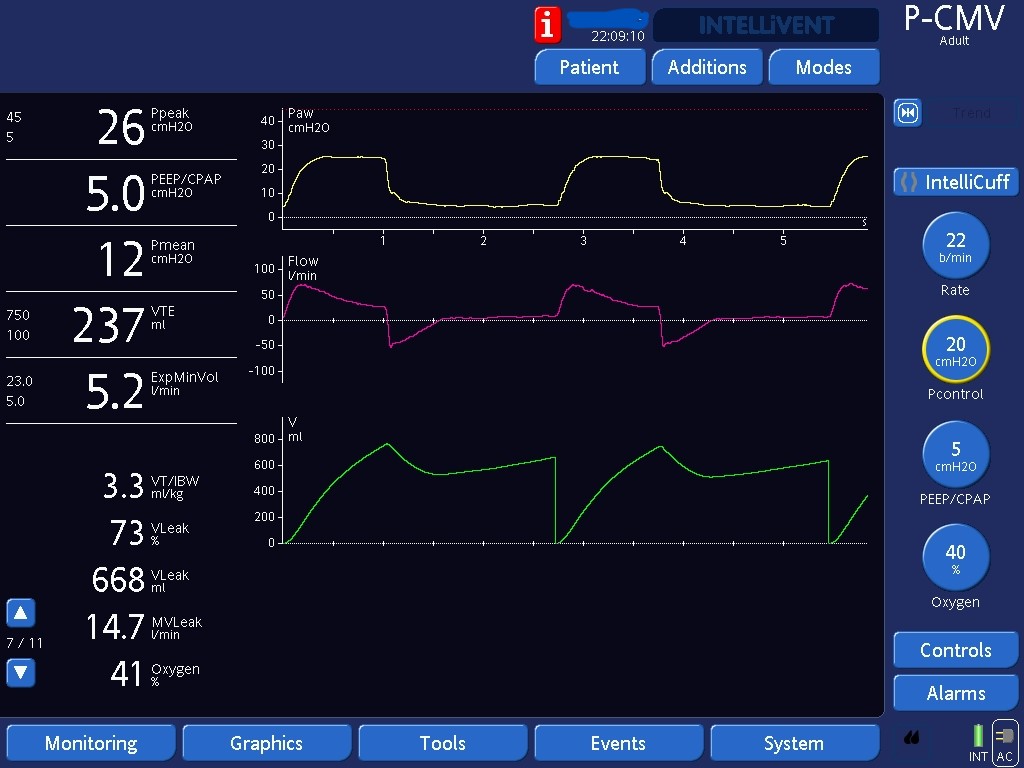
Fig 1.This waveform has several signs suggestive of a circuit leak, in this case secondary to the patient’s alveolar-pleural fistula: 1) The ventilator will estimate the leak percentage based on the difference between delivered and returned volumes; this is reported as the VLeak% measured at 73% by the ventilator on the left lower corner. When there is a circuit leak, delivered volumes are greater than returned since a percentage of the volumes escaped from the circuit. 2) The area under the curve (AUC) of flow-time equals tidal volumes. Note how the AUC of inspiratory flows is much greater than that of expiratory flows, an additional clue to the presence of a leak. 3) The volume-time curve depicts the delivered volume on the ascending limb and the returned volume on the descending limb. Note that the descending limb stops decreasing soon after the beginning of expiration. This is because the rest of the delivered volume leaked out of the circuit. Before the next inspiration, the ventilator zeroes the volume waveform, leading to the sharp reset you see in this picture. Note that the height of the sharp reset gives you a clue to the severity of the leak.